Friday Focus on IFR
4 September 2015 (2100Zulu)
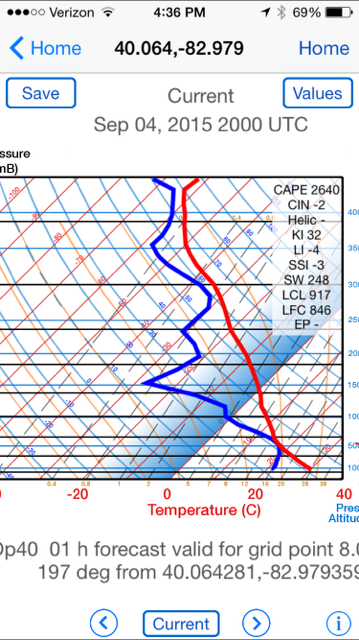
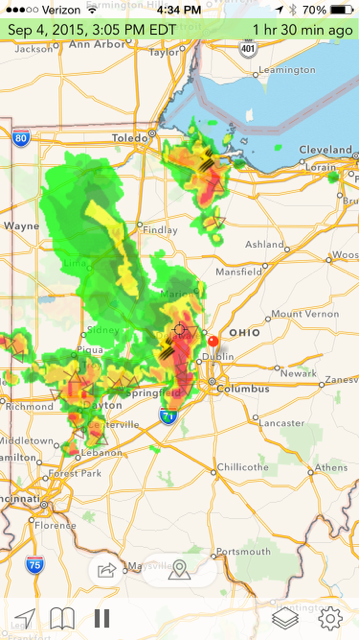
Check out the current radar display for central Ohio (Columbus is the red dot), and the current Skew T chart. The math usually wins out. Note the Lifted/K Index (-4/32), indicating the relative instability of the atmosphere (-4) and the high temperature-moisture profile in the air (32). These are two ingredients for T-Storms. Also, and perhaps more importantly, note the CAPE (Convective Available Potential Energy) index (2640). Indicies exceeding 1000-1500 are positive signs of convective potential. The radar image confirms theses data. You gotta love the physics of how this plays out!
+++++++++++++++++++++++++
This entry was posted in Uncategorized. Bookmark the permalink.
← Friday Focus on IFR Friday Focus on IFR →
Leave a Reply